When an engineer sizes a greenhouse heating or cooling system, the most common approach is to pick a design day, typically a single worst-case temperature, and calculate the load from there. It is a well-established method for conventional buildings. However, for a greenhouse, it is a significant oversimplification.
A greenhouse is not a warehouse with windows. It is a dynamic thermal environment that changes hour by hour, day by day, season by season. The amount of heat coming through the glazing at 2 pm on a July afternoon is completely different from what enters at 7 am on the same day. The heating demand on a cold February night is not simply the inverse of the summer cooling problem. And neither of those scenarios tells you what the system is expected to do across the other 8,758 hours of the year. This is where greenhouse energy modeling changes the process.
Dynamic thermal simulation is how Ceres answers those questions, before construction begins.
What Dynamic Thermal Simulation Does
Instead of calculating the load for one moment in time, we simulate the full thermal behavior of your greenhouse across every hour of the year, using measured historical weather data and, where appropriate, projected hourly climate scenarios for the project location.
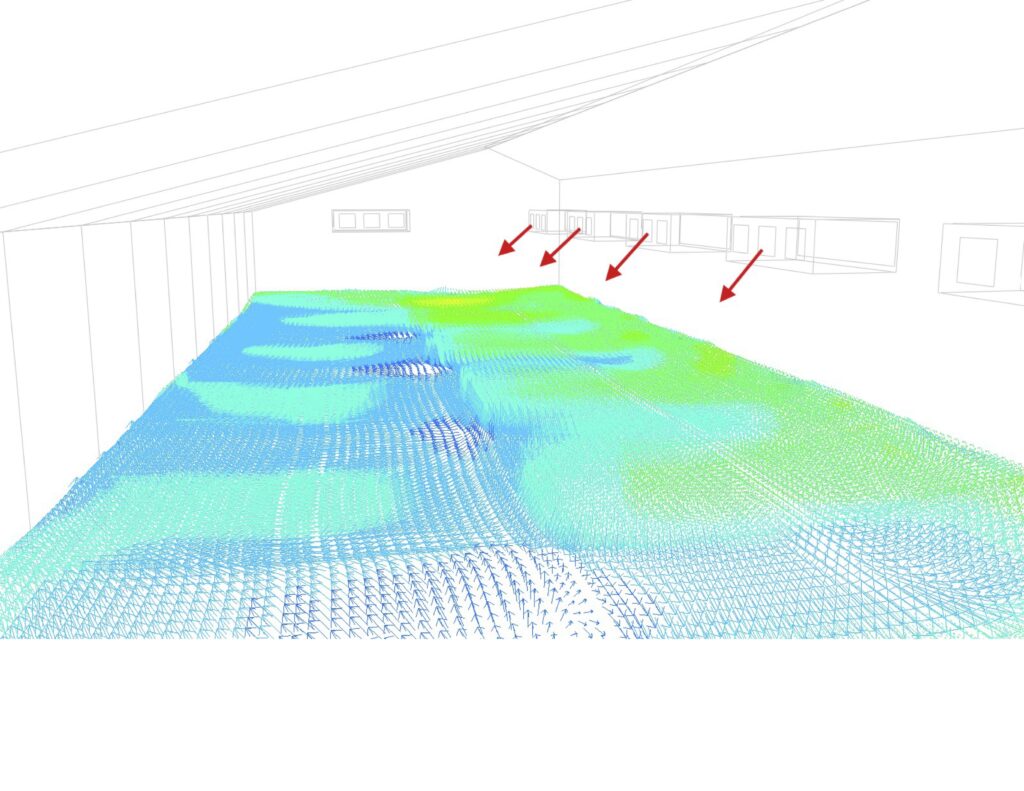
Ceres uses IESVE (Integrated Environmental Solutions Virtual Environment) to build a detailed three-dimensional model of your greenhouse: its geometry, orientation, glazing materials, insulation values, shading systems, ventilation openings, crop canopy, plant density, irrigation/growing systems, and other cultivation-related internal loads. It then runs that model against 8,760 hours of recorded hourly climate data representative of your project location, not national averages or regional estimates. This is the foundation of Ceres’ energy modeling process for every greenhouse project.
The output is not a single number, but rather a full picture of how your greenhouse behaves thermally across time: what temperatures it reaches, when peak loads occur, how different seasons affect the heating and cooling demand, and how the structure responds to the real range of conditions it will face over its operational life.
We are not calculating what your greenhouse might do in the worst case. We are simulating how it is expected to perform across the full operating year.
Where Traditional Greenhouse HVAC Design Falls Short
The design day method was developed for conventional buildings, and for those, it works reasonably well. But greenhouses behave differently, and the differences matter significantly as the scale of the greenhouse increases.
The effect of glazing
A typical commercial building might have 20 to 30 percent of its wall area as glass. A commercial greenhouse is often 70 to 100 percent glazing. That transforms the thermal behavior of the structure entirely. Solar heat gain, not ambient air temperature, becomes the dominant driver of cooling load. The angle of the sun, the time of day, the orientation of the structure, and the specific transmission properties of the glazing material all determine what happens inside. A single design day calculation captures none of this variation.
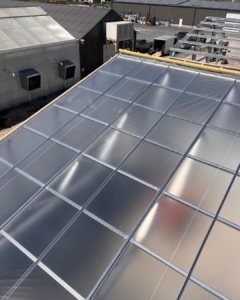
ETFE film, tempered glass, double-wall polycarbonate, and polyethylene film all transmit heat and light differently. A traditional load calculation typically assumes a glazing type rather than comparing them. Dynamic thermal simulation models each material individually, showing the modeled thermal performance difference between a double-wall polycarbonate roof and a glass roof at your specific site, across your full climate year.
Greenhouse systems are interconnected
The glazing affects the thermal load. The thermal load affects HVAC sizing. HVAC operation affects humidity levels, and humidity behavior affects dehumidification requirements. Unlike conventional buildings, the plants are also part of the mechanical problem. Crop transpiration adds moisture to the air, increases latent load, and changes how heating, cooling, ventilation, and dehumidification systems perform.
These interactions happen simultaneously and continuously throughout the year. A greenhouse model needs to account for the structure, the growing system, and the crop environment together. Evaluating them in isolation, as traditional calculations often do, can produce specifications that do not reflect how the greenhouse actually operates.
The crop itself also affects the environment: plant transpiration adds latent load, drives humidity behavior, and changes dehumidification demand.
Greenhouses are long-term investments
A commercial greenhouse represents a 20 to 30-year capital commitment. Dynamic simulation can incorporate projected climate change scenarios alongside historical data, helping owners understand not just how the greenhouse performs today, but whether the mechanical systems will remain adequate as conditions shift over the building’s full operational life.
| Traditional approach | Dynamic thermal simulation |
|---|---|
| Single worst-case design day | Full 8,760-hour annual simulation |
| One fixed outdoor temperature | Representative hourly weather data for your location |
| Systems sized in isolation | Key systems evaluated together |
| No seasonal variation | Temperature behavior modeled across every month |
| Glazing assumed, not compared | Different glazing materials modeled side by side |
| Problems found after construction | Design decisions evaluated before the build begins |
What The Simulation Covers: Dynamic Thermal Analysis
When Ceres runs a dynamic thermal simulation for a project, the analysis covers:
- Crop-environment interactions, including transpiration, humidity behavior, latent loads, and dehumidification demand
- Peak summer and winter temperature behavior under site-specific modeled weather conditions — not regional averages or standard design days
- Solar heat gain analysis tied to actual glazing materials, structure orientation, and shading systems
- Temperature fluctuation patterns across a typical day, week, and season — relevant to crop stress thresholds and system control strategies
- Performance during extreme weather events: heat waves, cold snaps, and shoulder season conditions that single design-day calculations may miss
- Glazing material comparison: ETFE film, tempered glass, double-wall polycarbonate, and polyethylene film (or any other glazing material) modeled side by side, so procurement decisions are based on simulated performance rather than specification sheets
- Climate change scenario modeling — how the greenhouse performs under projected future conditions across its full operational life
*A NOTE ON GLAZING COMPARISON
One of the most practically useful outputs of dynamic thermal simulation is a direct material comparison. In a $5M commercial greenhouse project, the difference in annual energy cost between polycarbonate and ETFE can be significant, and that difference varies by climate, orientation, and crop type. Simulation quantifies it for your specific location and design before you commit to procurement.
What Does This Mean For Your Project?
Dynamic thermal simulation directly affects decisions with real financial and operational consequences for commercial greenhouse owners and research facility directors.
Already have an SOP? We can incorporate standard operating procedures into your simulation.
| Area | What simulation supports |
|---|---|
| Equipment sizing | Simulation-derived loads can differ significantly from rule-of-thumb estimates, especially when crop transpiration, latent loads, humidity control, solar gain, ventilation, and grow system inputs are evaluated together. Oversized HVAC equipment costs more to purchase and operates less efficiently at part load. Undersized equipment cannot maintain target growing conditions when it matters most. Our energy modeling process produces more complete load data that supports better specification. |
| Glazing selection | If you are choosing between glazing materials, simulation gives you modeled thermal performance data for your site and climate. |
| Energy cost projections | A full annual simulation produces hour-by-hour energy demand data, the basis for accurate operational cost projections and the technical documentation often required for utility rebate applications. |
| Design validation | If your architect or structural engineer proposes a particular roof pitch, orientation, or shading configuration, simulation helps estimate what that decision costs or saves thermally. |
| Climate resilience | For a 20 to 30-year capital investment, simulation can incorporate projected climate scenarios to test whether the mechanical systems will perform adequately as conditions shift over the building’s operational life. |
| Lender and investor documentation | Energy performance projections based on simulation are more specific and defensible than general estimates. For projects requiring financing or institutional approval, a documented thermal analysis supports the investment case. |
Utility Rebates: How Energy Modeling Supports Incentive Applications
Many utility providers offer rebate and incentive programs for commercial facilities that meet specific energy performance thresholds. Most of those programs may require modeled savings or engineering documentation as part of the application process, relying on simulation-based analysis to demonstrate the facility’s projected energy performance.
The thermal simulation Ceres produces as part of the design process can provide the technical foundation for those applications. Ceres supports clients through the rebate process, and a number of our clients have used energy modeling outputs to support utility incentive applications that may help offset project costs.
If utility rebate programs are available in your area, it is worth building the modeling work into your project timeline early.
Contact us to discuss what programs may apply to your project.
Next in the series: natural ventilation and CFD airflow analysis
Part 2 of Inside the Model covers natural ventilation modeling and CFD airflow analysis: how we evaluate whether a proposed ventilation strategy will perform at your site, where the airflow gaps are, and how much mechanical cooling can be displaced before the first piece of equipment is specified.
| ALSO IN THIS SERIES Part 1 — Dynamic Thermal Simulation (this post) Part 2 — Natural Ventilation Modeling and CFD Airflow Analysis Part 3 — HVAC System Simulation: Real Performance vs. Nameplate Data Part 4 — Humidity and Environmental Control Analysis Part 5 — Sustainability, Electrification, and Utility Incentives |
| Ready to see your greenhouse modeled before you build it? Download the free Greenhouse Performance Guide — or speak with a Ceres engineer about your project. |